Introduction: The Funnel Nobody's Drawing
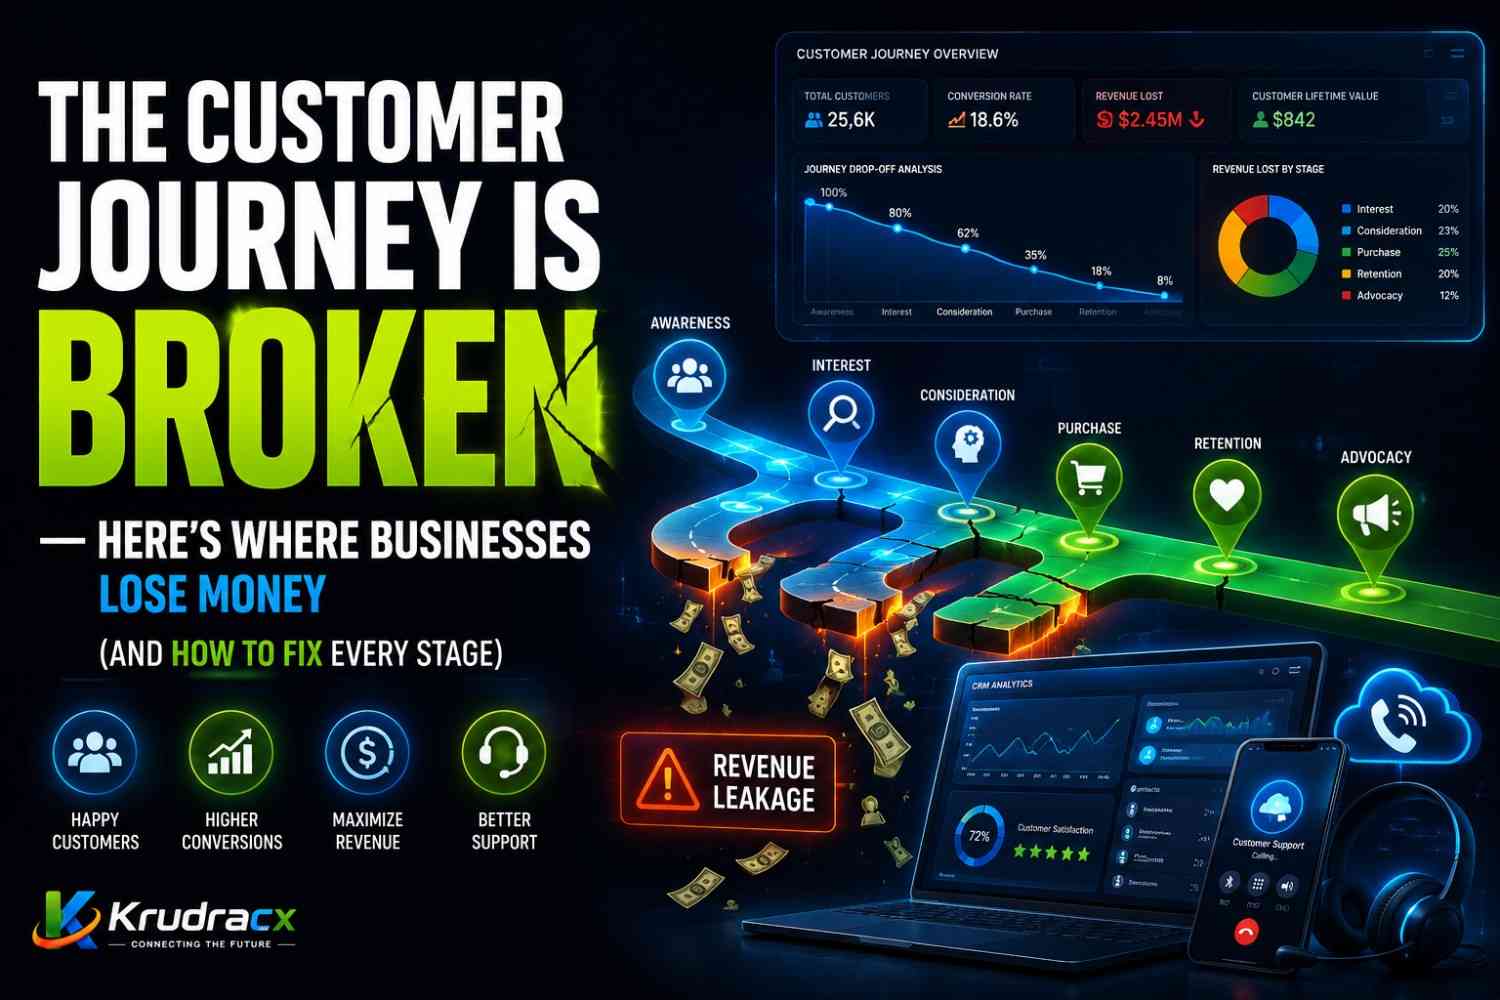
Walk into any marketing or sales meeting and you'll see it on a whiteboard within minutes: the funnel. Awareness, interest, consideration, conversion. Every stage measured, every drop-off analyzed, every dollar of spend tracked against where it lands in that journey.
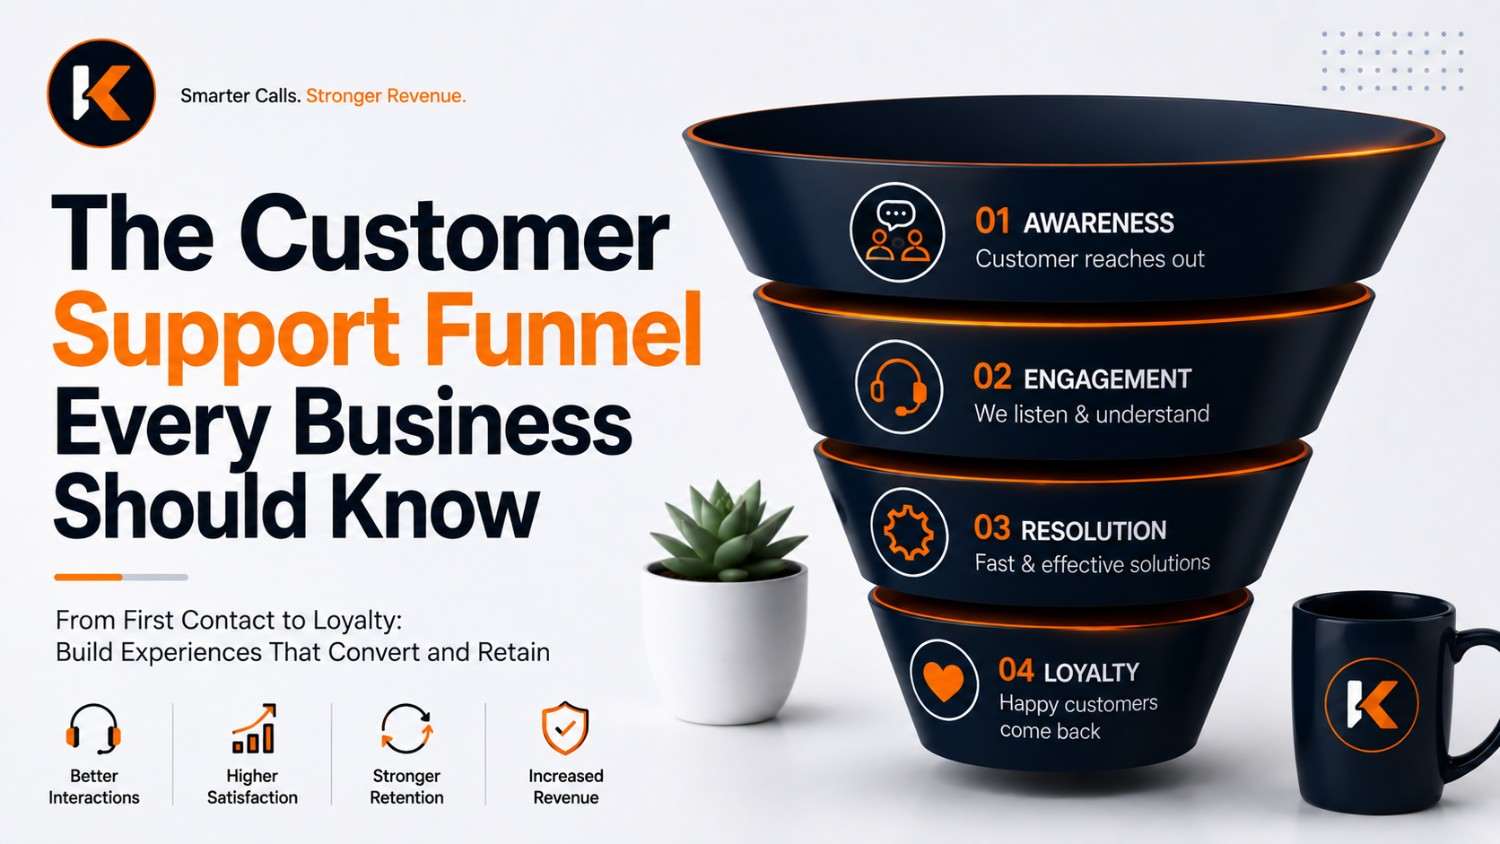
Now ask the same company to draw their support funnel — the journey a customer takes from the moment they need help to the moment their issue is fully resolved and their trust is restored. Most teams can't do it. Support is treated as a single, undifferentiated box: "customer contacts us, we help them." There's no funnel thinking, no stage-by-stage analysis, no systematic effort to find where customers are dropping off, getting frustrated, or quietly deciding to leave.
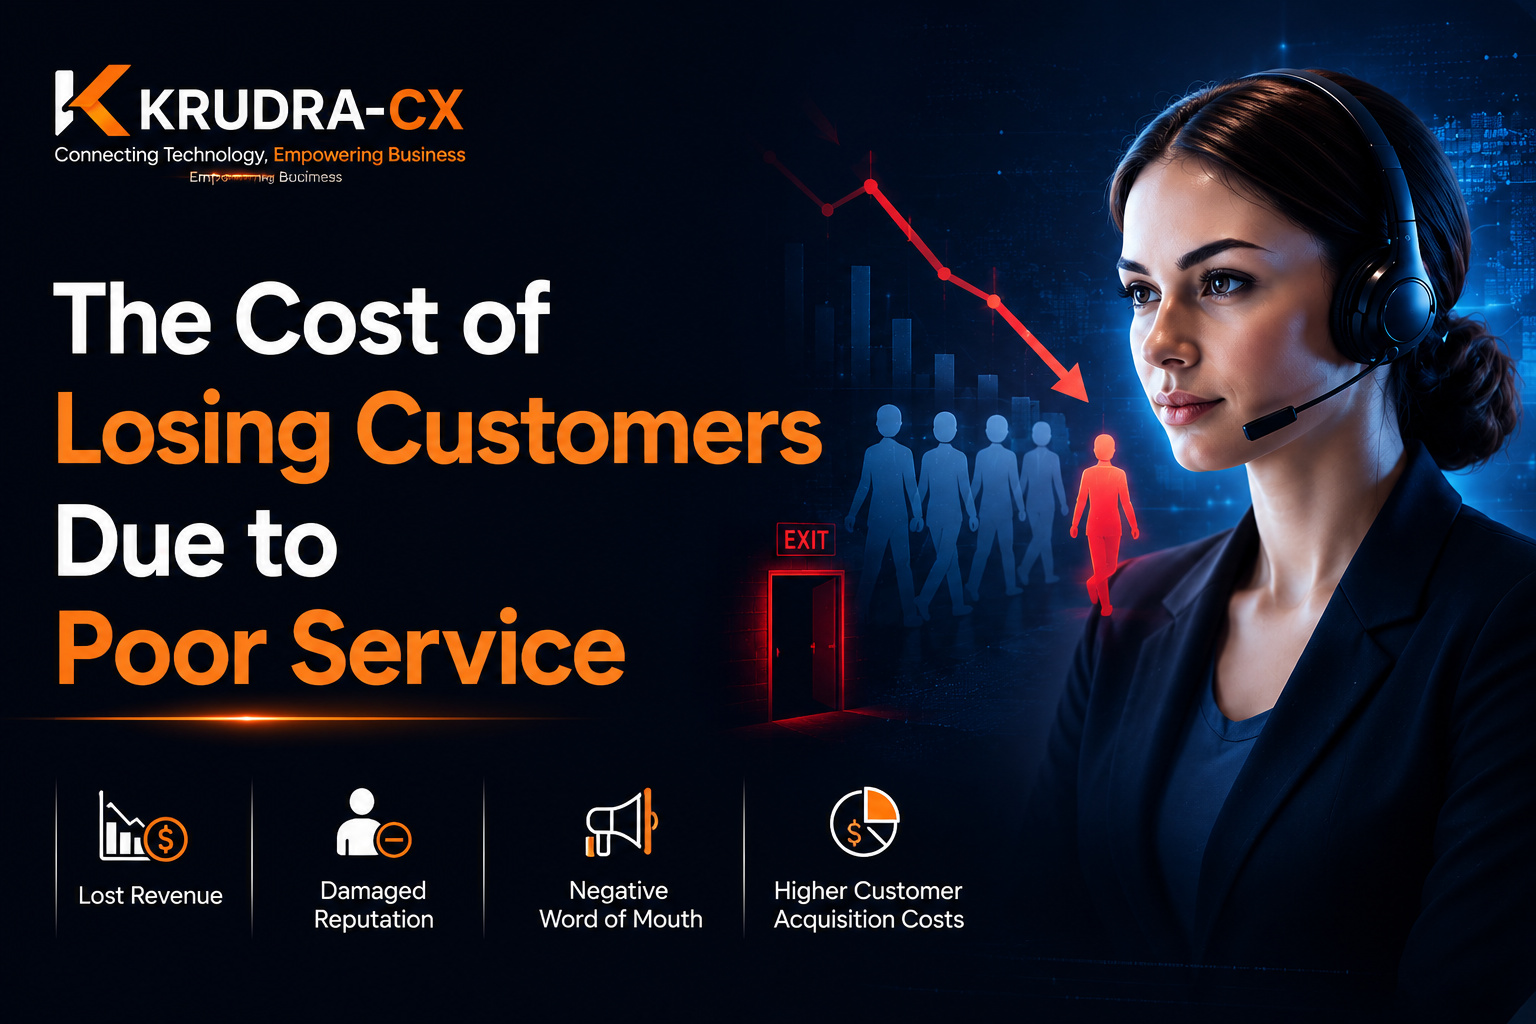
This is a massive blind spot, because the support funnel is arguably more important to long-term revenue than the sales funnel. Acquiring a customer is expensive. Losing one because of a broken support experience is even more expensive, because it wastes everything spent to acquire them in the first place. A well-mapped support funnel doesn't just fix complaints faster — it becomes a retention engine, a source of product insight, and in many cases, the single biggest lever a business has for improving lifetime value.
This post lays out what the customer support funnel actually looks like, stage by stage, why businesses lose customers at each point, and what to measure and fix at every level.
Why Businesses Ignore the Support Funnel
Before getting into the stages themselves, it's worth understanding why this funnel gets so little strategic attention compared to sales and marketing.
Support is treated as a cost center, not a growth lever. Budgets get allocated based on that assumption, and cost centers get cut, not invested in. This framing alone prevents most leadership teams from asking the deeper question of whether support is actually working as a system.
Support data is scattered across tools. Ticketing systems, live chat platforms, call center software, and social media all capture pieces of the customer support journey, but rarely in one place. Without a unified view, it's nearly impossible to see the funnel as a whole rather than a series of disconnected touchpoints.
Success is measured by speed, not by funnel health. Metrics like average response time and average handle time dominate reporting, while metrics that would reveal funnel leakage — repeat contact rate, resolution abandonment, post-resolution churn — are rarely tracked at all.
There's no shared ownership. Sales owns the sales funnel. Marketing owns the marketing funnel. Support often sits under operations, customer success, or is split across multiple departments, with no single owner responsible for the end-to-end journey.
Once a business starts thinking about support as a funnel — with defined stages, drop-off points, and conversion metrics — the opportunities for improvement become obvious almost immediately.
The Six Stages of the Customer Support Funnel
Stage 1: Issue Recognition
Before a customer ever contacts support, they go through a moment of recognizing that something is wrong or that they need help. This stage happens entirely outside your direct visibility, but it shapes everything that follows.
At this stage, customers are forming an initial judgment: is this worth the effort of reaching out? Is this company likely to help me, or will I be wasting my time? Prior experiences — their own or ones they've heard about — heavily influence this decision.
What goes wrong here: Customers who've had a frustrating support experience before will often delay contacting you, try to solve the problem themselves through workarounds, or in the worst case, simply give up and quietly disengage from the product or service without ever filing a complaint. This is the most dangerous form of funnel leakage, because it's invisible. You never see the ticket that was never filed.
What to measure: This stage is hard to measure directly, but proxies exist — product usage drop-off patterns, unusual support-adjacent search activity on your help center, or spikes in cancellation without a preceding support contact. If customers are churning without ever contacting support, that's a strong signal that Stage 1 friction is pushing them to leave silently rather than reach out.
Stage 2: Channel Selection
Once a customer decides to seek help, they choose how to reach out — phone, email, live chat, social media, self-service help center, or increasingly, a chatbot. This decision is shaped by urgency, past experience with each channel, and how easy each option is to find.
What goes wrong here: If the "right" channel for a given issue isn't obvious or easy to find, customers waste time hunting for contact information, or pick a channel poorly suited to their problem (e.g., trying to resolve a complex billing dispute over chat when a phone call would resolve it in a fraction of the time). Poor channel design at this stage creates friction before the actual support conversation even begins.
What to measure: Channel distribution relative to issue type, time-to-first-contact by channel, and abandonment rate at the point of channel selection (e.g., customers who open a contact page but never complete an inquiry).
What to optimize: Make channel options visible and clearly labeled by use case — "For billing questions, chat with us" vs. "For urgent account issues, call us" — rather than a generic list of contact methods with no guidance. Route based on issue complexity where possible, nudging simple questions toward self-service and complex ones toward higher-touch channels.
Stage 3: Initial Contact & Triage
This is the moment the customer actually reaches a human or automated system — the first IVR prompt, the first chatbot message, the first line of an email response. This stage sets the tone for everything that follows and is one of the highest-leakage points in the entire funnel.
What goes wrong here: Long IVR menus, slow initial response times, chatbots that fail to understand the issue and loop the customer in circles, or triage processes that require customers to repeat information multiple times before reaching someone who can actually help. Every one of these creates an opportunity for the customer to abandon the interaction entirely, often before their actual problem has even been heard.
What to measure: Abandonment rate at first contact (calls dropped in IVR, chats abandoned before a response, emails that go unanswered long enough for the customer to escalate elsewhere), time-to-first-response by channel, and first-contact resolution rate for very simple, common issues that should be handled instantly.
What to optimize: Simplify triage flows dramatically. Reduce IVR depth, make chatbot escalation-to-human fast and frictionless rather than a last resort, and ensure customers aren't asked to re-explain their issue if they've already provided context (through account lookup, prior ticket history, or channel-switching continuity).
Stage 4: Problem Diagnosis & Resolution
This is the core of the support interaction — the agent or system actually understanding the issue and working to resolve it. It's the stage most businesses focus their entire QA and training effort on, and for good reason: it's where the customer's actual problem either gets solved or doesn't.
What goes wrong here: Agents lacking the tools, information, or authority to resolve the issue on the spot, leading to unnecessary escalations or "I'll have someone call you back" outcomes. Poor internal knowledge management causing agents to give inconsistent or incorrect information. A focus on speed (driven by AHT pressure) that leads to rushed diagnosis and incomplete fixes that generate repeat contacts.
What to measure: First Contact Resolution (FCR) — the single most important metric at this stage — along with escalation rate, average resolution time, and repeat contact rate within a defined window (24-72 hours is common) for the same issue.
What to optimize: Give frontline agents genuine authority to resolve common issues without escalation. Invest in accessible, accurate, and continuously updated internal knowledge bases. Rebalance performance metrics so agents aren't incentivized to rush diagnosis in service of a lower handle time. This is the stage where the earlier point about AHT obsession becomes most costly — a rushed diagnosis here creates leakage at every subsequent stage.
Stage 5: Confirmation & Follow-Through
Once a resolution is proposed or delivered, there's a critical moment where the customer needs confirmation that the issue is actually fixed — not just that the agent believes it's fixed. This stage is frequently skipped or rushed, and it's a significant, under-recognized source of funnel leakage.
What goes wrong here: Agents close tickets or end calls based on their own assessment that the issue is resolved, without verifying the fix actually worked from the customer's perspective. Customers who are told "this should be fixed now" without any follow-up often discover days later that it wasn't, and now have to start the entire process over — this time with less patience and lower trust.
What to measure: Ticket reopen rate, post-resolution repeat contact rate, and CSAT scores specifically tied to "was your issue actually resolved" rather than just "how was your interaction" (these can diverge significantly — a pleasant agent doesn't always mean a solved problem).
What to optimize: Build explicit confirmation steps into resolution workflows — a follow-up message or call for anything beyond a trivial fix, especially for technical issues where the customer may not be positioned to verify the fix immediately. Track reopened tickets as a distinct, visible metric rather than folding them into general volume.
Stage 6: Post-Resolution Relationship
The support funnel doesn't end when the ticket closes. How a business behaves after resolving an issue — or after failing to resolve one — shapes whether that customer remains loyal, becomes an advocate, or quietly starts looking at alternatives. This is the stage most consistently ignored, because most support organizations consider their job done the moment the ticket status changes to "closed."
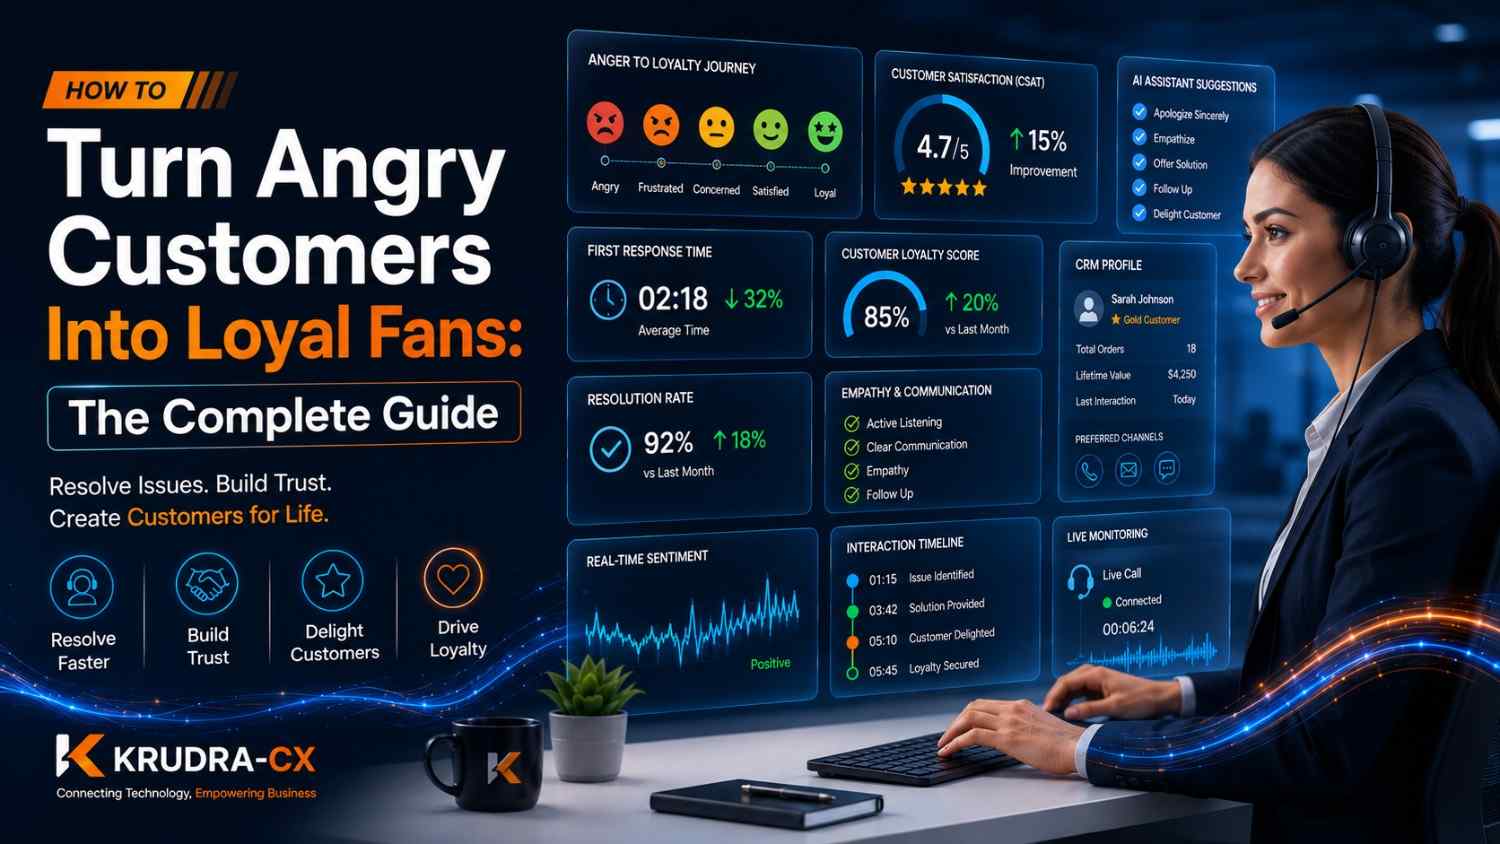
What goes wrong here: No proactive outreach after a significant issue to confirm long-term satisfaction. No mechanism for feeding recurring support themes back into product or policy decisions, meaning the same issues keep generating the same volume of tickets indefinitely. No differentiation in relationship-building between a customer who had a smooth first-contact resolution and one who endured a frustrating, multi-touch ordeal to get the same outcome — the second customer needs more relationship repair than a closed ticket alone provides.
What to measure: Customer retention and churn rates segmented by support history (customers who had a difficult support experience vs. those who didn't), Net Promoter Score trends following support interactions, and the rate at which recurring issues get escalated into product or policy changes rather than being repeatedly handled as one-off tickets.
What to optimize: Build a feedback loop between support and product/operations teams so recurring issues actually get fixed at the source, not just repeatedly patched at the ticket level. For customers who had a notably difficult support journey, consider proactive follow-up beyond the standard CSAT survey — a genuine check-in can meaningfully rebuild trust that a single resolved ticket doesn't fully restore.
Where Most Businesses Lose the Most Customers
Across all six stages, two points consistently account for the largest share of funnel leakage:
Stage 1 (Issue Recognition) leakage is invisible but massive. Customers who never contact support at all, and simply churn instead, represent lost revenue that never shows up in any support dashboard. This is why support metrics alone are insufficient — they only capture people who made it into the funnel, not the ones who decided it wasn't worth entering.
Stage 4 (Resolution) leakage compounds everything downstream. A poorly resolved issue doesn't just fail once — it generates a repeat contact, which restarts the customer through Stages 2 and 3 with lower patience and higher frustration than the first time. This is why First Contact Resolution is consistently cited as one of the most important metrics in customer support: getting it right the first time prevents leakage from compounding across the rest of the funnel.
Building a Support Funnel Dashboard
To actually manage the support funnel like a funnel — rather than a collection of disconnected metrics — businesses need a dashboard that tracks conversion and drop-off at each stage, not just aggregate volume. A useful structure includes:
Entry-point visibility: Volume and trend of customers reaching Stage 2 (channel selection), cross-referenced against product usage or account data to estimate how many customers with issues never entered the funnel at all.
Stage 3 conversion: Abandonment rate at initial contact, broken down by channel, with clear targets for reduction.
Stage 4 conversion: FCR rate, escalation rate, and average resolution time, tracked by issue type so patterns in specific problem categories become visible.
Stage 5 conversion: Reopen rate and post-resolution repeat contact rate, ideally tracked per agent and per issue type to identify where confirmation steps are being skipped.
Stage 6 outcomes: Retention and NPS trends segmented by support history, plus a running log of recurring issues that have been escalated to product or policy teams for permanent fixes.
This kind of dashboard turns support from a reactive cost center into a measurable system with clear points of intervention — exactly the way a sales or marketing funnel is already treated.
Why This Matters More in 2026 Than Ever Before
Customer expectations around support have shifted substantially. Customers increasingly compare their support experience with any company against the best support experience they've had anywhere, not just against direct competitors. A slow, frustrating support funnel doesn't just lose to a competitor with a better support team — it loses to every other frictionless digital experience a customer has had that week.
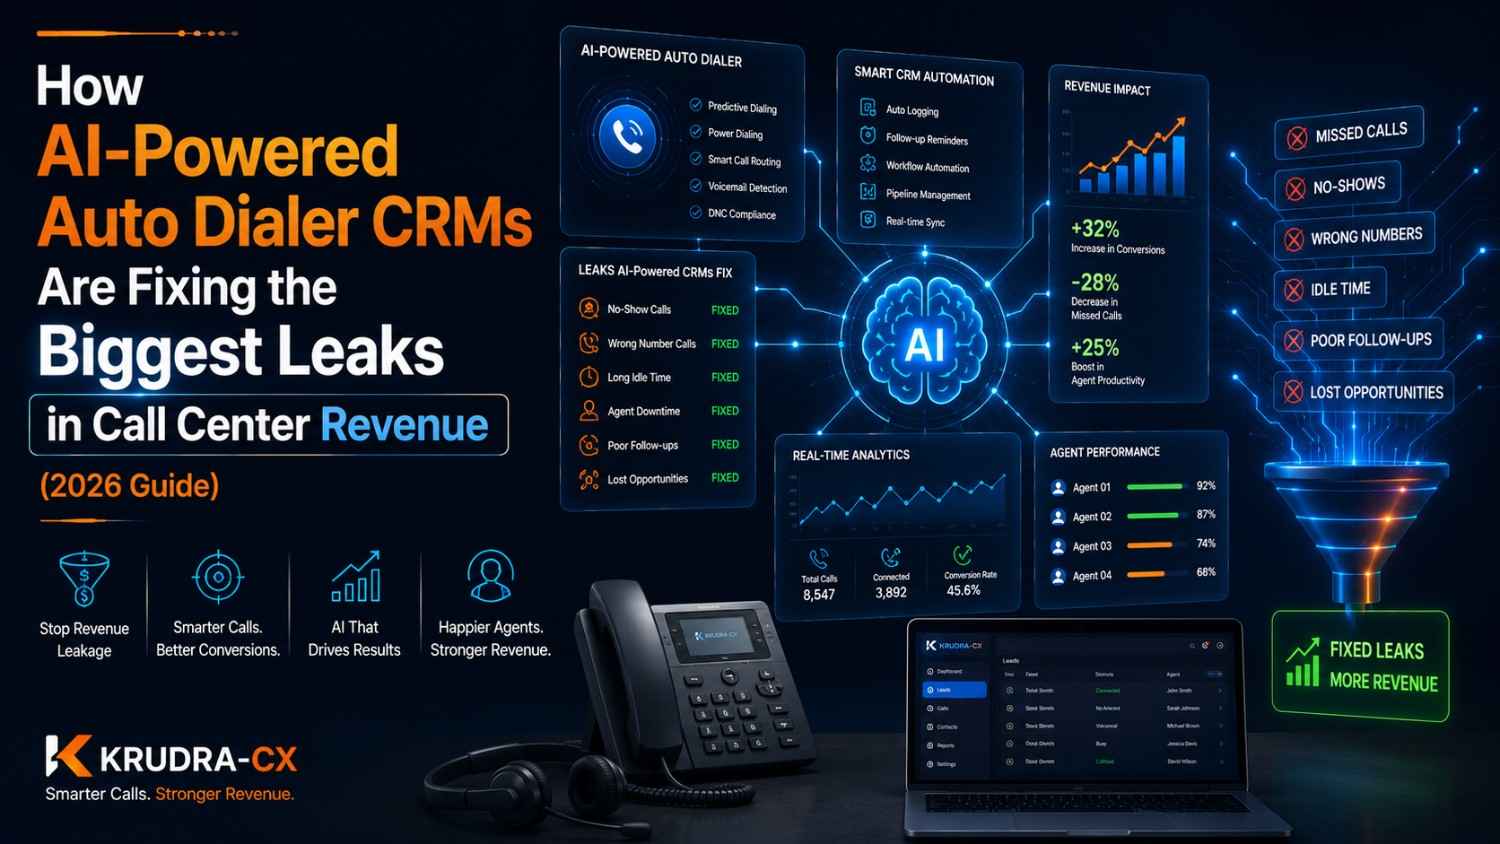
At the same time, the tools available to map and optimize this funnel have matured significantly. AI-powered voice and text analytics can now surface Stage 4 diagnosis quality at scale, unified customer data platforms can connect Stage 1 signals (product usage, engagement drop-off) with Stage 6 outcomes (retention, churn) in ways that were previously impossible, and modern contact center platforms can track reopen rates and repeat contacts automatically rather than requiring manual analysis.
The businesses that treat support as a funnel — measured, optimized, and owned end-to-end — are positioned to turn what has historically been viewed as a cost center into one of their strongest retention and growth levers.
Every business already understands the value of mapping a funnel: knowing where prospects drop off, why, and what to fix. The customer support journey deserves exactly the same discipline, and most businesses simply haven't applied it yet.
From the invisible moment a customer first recognizes they need help, through channel selection, triage, diagnosis, confirmation, and the ongoing relationship after resolution — each stage has its own failure points, its own metrics, and its own opportunities for improvement. Businesses that map this funnel and actively manage conversion at each stage don't just resolve issues faster. They retain more customers, generate fewer repeat contacts, and turn support from a reactive necessity into a genuine competitive advantage.
The sales funnel gets a dashboard, a dedicated team, and a seat in every strategy meeting. It's time the support funnel got the same.
Ready to Map and Fix Your Support Funnel?
If you can't see where customers are dropping off in your support journey, you can't fix it — and every unmapped leak is quietly costing you retention and revenue. KrudraCX helps businesses turn scattered support data into a clear, stage-by-stage funnel with the metrics that actually matter.
👉 Partner with KrudraCX today and find out exactly where your support funnel is leaking customers — and how to plug it.
Visit www.krudracx.com and start treating customer support like the growth engine it actually is.